To help us provide you with free impartial advice, we may earn a commission if you buy through links on our site. Learn more

The way we consume content has changed significantly in recent years, but TVs remain central to our home entertainment experience. They’re no longer just screens for enjoying live channels and streaming films and shows; they’re hubs for gaming, social media, smart home control, and almost everything else our daily routines entail.
As the humble TV’s role in our homes evolves, so must the brands that make and sell them. Competition is fiercer than ever; unknown brands in the UK a decade ago are now challenging the established order, forcing industry mainstays to rethink their strategies and, in some cases, forge new alliances to consolidate their positions.
This makes it a great time to be a consumer. You’re spoilt for TV choice, with manufacturers pushing different panel technologies, supporting different operating systems, and offering unique selling points. So, to gauge which brands the general public are buying, and how they feel about them, we surveyed 1,041 UK residents to name the Best TV Brands 2026 across a variety of important categories.
The table below shows the winners and highly recommended brands in each category, while below that, we’ve shone a spotlight on each brand that scooped an award.
Expert Reviews TV Brand Awards 2026
| Winner | Highly Commended | |
|---|---|---|
| Best Overall | Hisense | Sony |
| Most Recommended | Hisense | Sony |
| Value for Money | Philips | Hisense |
| Picture Quality | Philips | Hisense |
| Sound Quality | Hisense | Sky |
| Smart Features | Sky | Hisense |
| Gaming | TCL | Philips |
| Streaming | Sony | LG |
| Home Cinema Experience | Sony | TCL |
Hisense
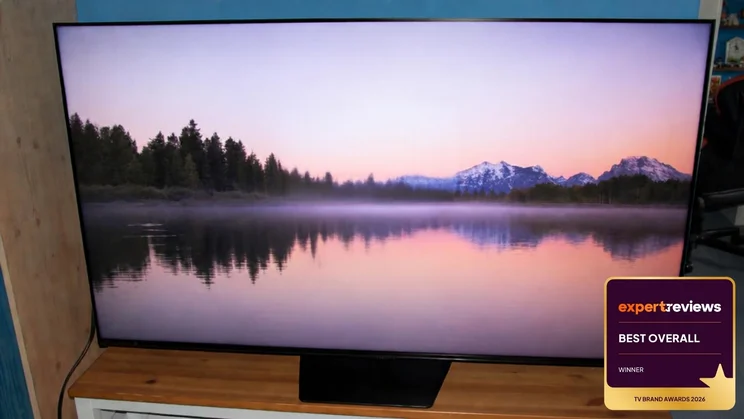
| Scorecard – Hisense | ||
|---|---|---|
| Overall score | 87% | 1st🥇 |
| Recommendation score | 39% | 1st🥇 |
| Value for money score | 97% | 2nd🥈 |
| Picture quality score | 95% | 2nd🥈 |
| Sound quality score | 90% | 1st🥇 |
| Smart features score | 96% | 2nd🥈 |
| Streaming score | N/A | N/A |
| Gaming score | N/A | N/A |
| Home cinema score | N/A | N/A |
N/A: The brand didn’t achieve the required number of respondents in this category to qualify for data analysis.
Our verdict
It’s been a huge year for Hisense, with its FIFA World Cup sponsorship giving it worldwide exposure. And those who’ve bought a Hisense TV in the past 12 months have been as happy as Spain’s winning squad.
The manufacturer scooped three awards: Best Overall, Most Recommended and Best for Sound Quality. It beat Sony (85%), Samsung (83%) and LG (82%) to the overall crown; a real achievement for the brand, which has pioneered RGB Mini LED technology and brought super-sized models to market at surprisingly accessible prices this year.
Hisense not only secured a hat-trick of wins, but it was Highly Commended in three further categories. Despite 96% of purchasers saying they were either Satisfied or Very Satisfied with the Value for Money of the Hisense TV they bought, Philips pipped it in that category with a 100% satisfaction rate.
In the Best for Picture Quality category, 2% of respondents were neutral about Hisense’s picture quality, knocking it into the runners-up spot. Meanwhile, the other category in which Hisense was Highly Commended, Best for Smart Features, was again decided by a 2% margin. While most Hisense TV users were very satisfied with its smart features, a few grumblers saw Sky win with flawless feedback.
Sony
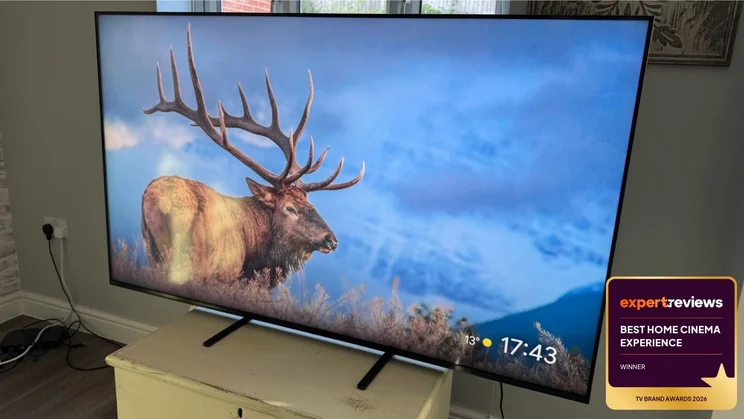
| Scorecard – Sony | ||
|---|---|---|
| Overall score | 85% | 2nd🥈 |
| Recommendation score | 48% | 2nd🥈 |
| Value for money score | 97% | 3rd |
| Picture quality score | 98% | 3rd |
| Sound quality score | 89% | 3rd |
| Smart features score | 95% | 3rd |
| Streaming score | 100% | 1st🥇 |
| Gaming score | 88% | 5th |
| Home cinema score | 95% | 1st🥇 |
N/A: The brand didn’t achieve the required number of respondents in this category to qualify for data analysis.
Our verdict
After leaving empty-handed in last year’s awards, Sony is back with a bang, scooping a Best for Streaming and Best Home Cinema Experience double. The former category is prestigious as it aggregates results across picture quality, sound quality, and smart and streaming functionality. Finishing ahead of TCL, which it is teaming up with to produce TVs from next year, and the South Korean giants LG and Samsung, is a major success and one that will be particularly pleasing given Sony’s longstanding association with the film industry.
In the Best for Streaming category, Sony was the only brand to achieve a 100% positive satisfaction rating. 62% of respondents with a Sony television said they were “Very Satisfied” with its performance for streaming movies and TV shows; the other 38% were “Satisfied” with ease of access to services, app responsiveness and streaming quality.
Sony may have narrowly missed out on the Best Overall and Most Recommended gongs, but more than half of respondents said they were “Very Likely” to recommend their Sony TV to a friend or relative, with just 5% saying that they weren’t likely to do so. It will be fascinating to see how well the brand retains customers once its partnership with TCL starts to bear fruit next year.
Philips
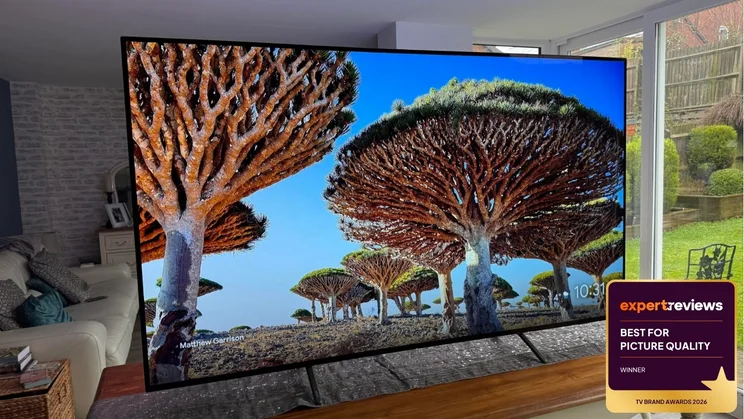
| Scorecard – Philips | ||
|---|---|---|
| Overall score | 76% | 8th |
| Recommendation score | 21% | 9th |
| Value for money score | 100% | 1st🥇 |
| Picture quality score | 100% | 1st🥇 |
| Sound quality score | 85% | 8th |
| Smart features score | 83% | 7th |
| Streaming score | N/A | N/A |
| Gaming score | 100% | 2nd🥈 |
| Home cinema score | N/A | N/A |
N/A: The brand didn’t achieve the required number of respondents in this category to qualify for data analysis.
Our verdict
Philips’ awards are two of the most sought-after: Best Value for Money and Best for Picture Quality. In both categories, the brand received nothing but positive responses. 31% of respondents were “Very Satisfied” with the combination of price, features and performance of their Philips TV, with the brand’s tellies hitting the “Satisfied” spot for the remaining 69%.
Just over half (52%) of Philips TV owners said they were “Very Satisfied” with their TV’s picture quality. Not a single respondent felt neutral, dissatisfied or very dissatisfied when reflecting on their purchase and subsequent viewing experience; an incredible result.
Philips was unfortunate not to make it a trio of triumphs. Every Philips TV owner was happy with their gaming experience, but only 36% reported being “Very Satisfied” compared with winner TCL’s 83%. Still, a fantastic showing for the brand, whose Ambilight TVs have received glowing reviews from us over the past two years.
Sky
| Scorecard – Sky | ||
|---|---|---|
| Overall score | 77% | 7th |
| Recommendation score | 38% | 7th |
| Value for money score | 87% | 10th |
| Picture quality score | 92% | 8th |
| Sound quality score | 90% | 2nd🥈 |
| Smart features score | 96% | 1st🥇 |
| Streaming score | N/A | N/A |
| Gaming score | N/A | N/A |
| Home cinema score | N/A | N/A |
N/A: The brand didn’t achieve the required number of respondents in this category to qualify for data analysis.
Our verdict
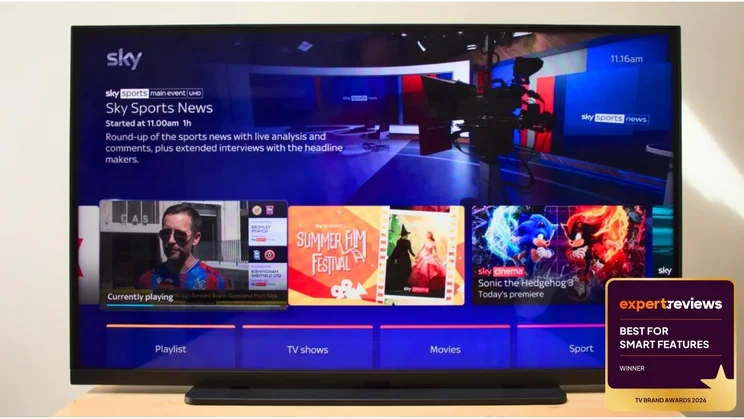
Sky couldn’t hold onto the Best for Sound Quality award it won last year, but respondents still loved the sound delivered by the brand’s Glass range of televisions. Over 50% said that they were “Very Satisfied” with the sound quality of their Sky TVs’ built-in speakers, and no respondents were “Dissatisfied” or “Very Dissatisfied”. However, the 10% who were “Neutral” about their audio experience cost Sky, seeing it fall behind Hisense, which had a fractionally higher Net Promoter Score.
The British broadcasting giant topped the table for smart features, however. This category assessed user satisfaction with their TV’s UI and features, including app provision, OS navigation, and smart home control. No Sky TV owner felt dissatisfied or very dissatisfied with their experience here, with just 4% feeling neutral. That earned it an NPS score of 96%, 1% higher than its nearest rivals, Hisense and Sony, and well above those of Korean manufacturers LG (90%) and Samsung (87%).
TCL
| Scorecard – TCL | ||
|---|---|---|
| Overall score | 80% | 5th |
| Recommendation score | 42% | 5th |
| Value for money score | 95% | 5th |
| Picture quality score | 95% | 7th |
| Sound quality score | 88% | 6th |
| Smart features score | 94% | 4th |
| Streaming score | 95% | 5th |
| Gaming score | 100% | 1st🥇 |
| Home cinema score | 93% | 2nd🥈 |
Our verdict
TCL was absent from our list of winners in 2025, but its stock has been rising in our eyes for a while, and it’s clearly rising in consumers’ eyes, too, – especially gamers, according to our survey. It was middle of the pack in most categories and fifth in the Best TV Brand Overall category behind industry heavyweights LG, Samsung and Sony. That’s a respectable result for a burgeoning brand, but seeing its fellow Chinese manufacturer Hisense waltz off with the big one will sting a bit.
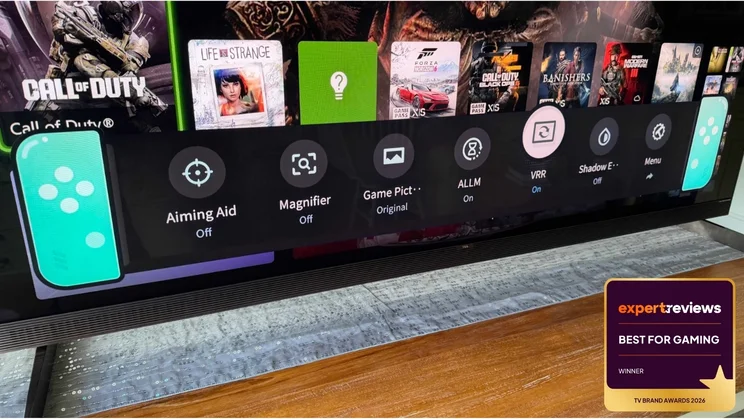
Still, a sensational performance in the Best for Gaming category shows how far the brand has come. Of survey respondents, 83% said they were very satisfied with their TCL TVs’ gaming performance; the other 17% were “Satisfied” – not one respondent had any complaints. With incredibly bright sets supporting Dolby Vision gaming, VRR, blazingly fast refresh rates and low input lag, we’re not surprised.
On the home cinema front, TCL’s NPS score of 93% saw the brand a couple of percentage points behind winner Sony. The two companies signed a joint venture agreement at the start of the year, so if TCL was going to lose to anyone here, I imagine it would choose its new Japanese business partner. It lost most ground in the streaming satisfaction component of the survey, one of four contributors to the Home Cinema Experience award, alongside picture quality, sound quality and smart features.
LG
| Scorecard – LG | ||
|---|---|---|
| Overall score | 82% | 4th |
| Recommendation score | 43% | 4th |
| Value for money score | 94% | 6th |
| Picture quality score | 97% | 4th |
| Sound quality score | 88% | 5th |
| Smart features score | 90% | 5th |
| Streaming score | 96% | 2nd |
| Gaming score | 90% | 4th |
| Home cinema score | 93% | 3rd |
Our verdict
LG won TV Brand of the Year in our inaugural awards last year, but has slipped to fourth this time around. That’s not to say the TVs it’s been producing have dropped in quality; our reviews of the G6 OLED and C6 OLED show that the manufacturer is still delivering some of the most engrossing viewing experiences around. Our survey respondents agreed on picture quality, with 63% “Very Satisfied” and 34% “Satisfied” with their LG TVs’ performance.
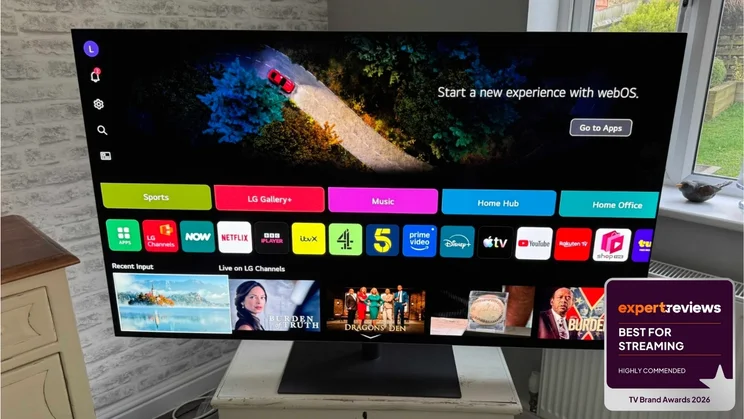
But LG’s streaming experience stood out to our survey respondents. 59% of LG owners said they were “Very Satisfied” with their TV’s performance when streaming movies and shows, 38% said they were “Satisfied”, and just 1% said they were “Dissatisfied” with the streaming picture quality, app responsiveness and ease of access to services. Only Sony polled better, with a 100% NPS. webOS is one of our favourite TV operating systems, and this result shows it’s a big selling point of LG televisions. The South Korean brand also secured a place on the Home Cinema Experience podium, with an NPS of 93%, but a brand with standards as high as LG will be targeting much higher finishes in 2027’s awards.
Expert Reviews TV Brand Awards 2026: Additional insights
In addition to analysing our survey results to recognise the top brands, we asked UK residents about their TV-viewing habits and wider use of technology.
TV use
When asked what they use their television for, our survey participants, who ticked all use cases that applied, responded as follows:
| Use case | % of respondents |
| Streaming movies and shows | 80 |
| Watching live TV broadcasts | 64 |
| Watching live sport | 55 |
| Watching YouTube | 50 |
| Gaming | 31 |
| Listening to music | 29 |
| Browsing the web | 12 |
Those results reflect how much more the TV has become in our homes. It functions as a home entertainment hub that connects different strands of our lives, while still being the focal point around which people gather to enjoy shared viewing experiences.
Watch hours
Are we a nation of telly addicts? Based on how many people we surveyed who typically watch more than three hours of TV a day, yes. Here are the results in full:
| Hours watched per week | % of respondents |
| Don’t use | 1 |
| Less than 5 | 11 |
| 5 to 9 | 17 |
| 10 to 14 | 19 |
| 15 to 20 | 20 |
| 21 to 30 | 19 |
| More than 30 | 13 |
TV use versus smartphone use
In addition to asking about how much TV our respondents watch each week, we asked them to estimate how much they use their smartphone.
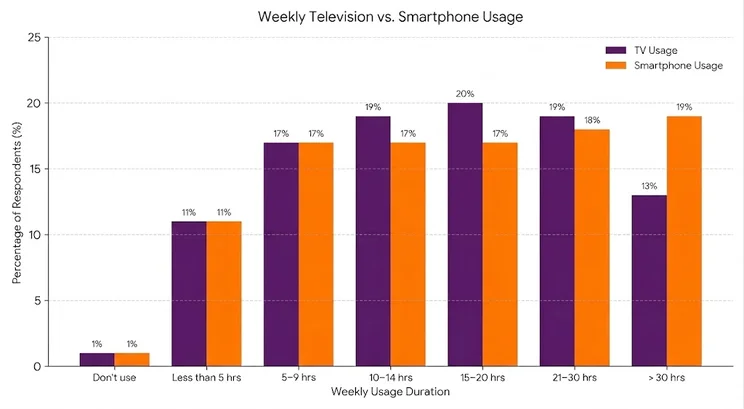
As shown in the graph below, the number of people using their device relatively lightly (under 10 hours) is very similar, but TV edges ahead when usage rises to between 10 and 20 hours. However, people were significantly more likely to use their smartphones for over 30 hours than they were to watch TV for similar lengths of time. Or were at least more willing to admit it.
Influences when buying a TV or electrical appliance
Choosing the right television has become increasingly difficult due to the sheer number of options available. So, we asked our survey participants which sources they use when planning to purchase electrical appliances for their home. Here are the results:
| Source | % of respondents |
| Retailers and brands | 44 |
| Consumer review publications | 39 |
| Recommendations from family/friends | 36 |
| Social media/influencers | 20 |
| None of the above | 15 |
It should come as no surprise that in this day and age, people use multiple sources to learn about products before buying them. The visibility of big brands and retailers, and trust built up over years, still has the biggest sway, but reviews from impartial third parties like us play a big role in people’s purchasing decisions.
How the 15% of those who responded “None of the above” choose what to buy is anyone’s guess, but it’s interesting that only one in five people is moved by social media and influencers. This may be down to a lack of trust in a newer form of opinion-sharing that some see as polluted by paid-for reviews and sponsored content.
Expert Reviews TV Brand Awards 2026: Methodology
Survey collection
We conducted our survey in July 2026 and targeted a representative sample of 1,041 UK residents. The survey captured regional data, allowing us to analyse trends across different geographical regions.
Qualifying brands
Our 13-question survey captured data on 10 TV brands. To ensure the integrity of our analysis, we applied a minimum sample size threshold; all 10 brands met this and were therefore eligible for evaluation. Of the ten eligible brands, six won an award.
Eligible brands: Hisense, LG, Panasonic, Philips, Samsung, Sony, Sharp, Sky, TCL, Toshiba
Analysis approach: NPS explained
Winners were determined using NPS (Net Promoter Score) analysis. This approach takes the percentage of respondents who selected the two positive responses (“Very Satisfied” and “Satisfied”) – the Promoters – and subtracts it from the percentage of respondents who selected the two negative responses (“Very Dissatisfied” and “Dissatisfied”) – the Detractors.
By accounting for both positive and negative responses, we gained a full picture of customer sentiment while maintaining the most rigorous analysis possible.